Buying a new house is not the same as buying an existing one, and the…
The average home in Quebec 5 revealing figures
Year after year, evaluators, inspectors, technicians and other Legault-Dubois building specialists assess numerous cases. We’ve had the opportunity to visit commercial buildings, construction sites at various stages of completion, apartment buildings and condominiums of two, three and even 300 units. But for this article, we had to make some hard choices. So we chose 20,000 single family home files to give you a good idea of the typical home found in the southern part of the province. Read our article and see the average Quebec home through 5 revealing numbers.
* Notice: these figures do not represent the absolute Quebec reality and are not based on any scientific approach. They are taken from our own statistics from a sampling of our records of houses inspected by Legault-Dubois. These figures are averages and do not take into account differences between regions and climates or subsidy programs that may influence the reasons for our visits in the first place.
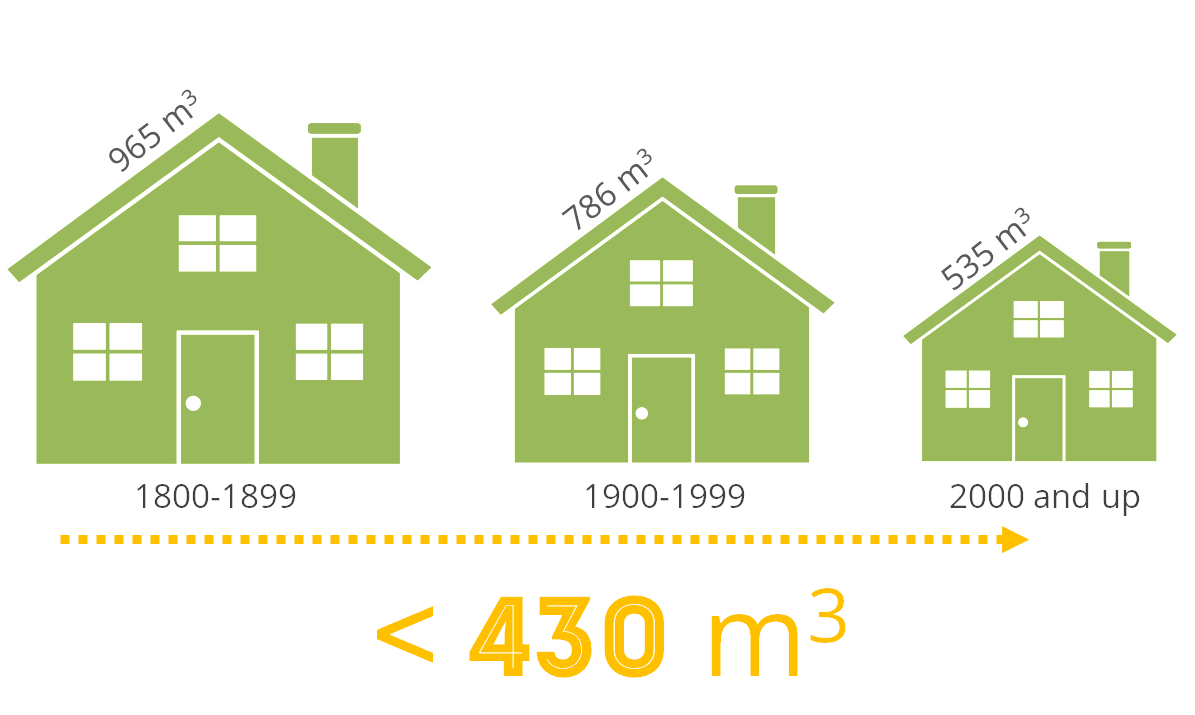
1. 56% of all houses built between 1800 and 1899 had 2 or more floors, but this proportion would change a century later, dropping to 26% between 1900 and 1999. And who says fewer floors also says less space and smaller house. This is reflected directly through various data collected by our inspectors, but no figure speaks louder than this one: 430. This is the difference in volume (cubic meter) between homes built in the 1800’s and those after 2000. Indeed, the size of the standard Quebec house is now almost half of what it used to be, going from 965 m3 to just 535 m3.
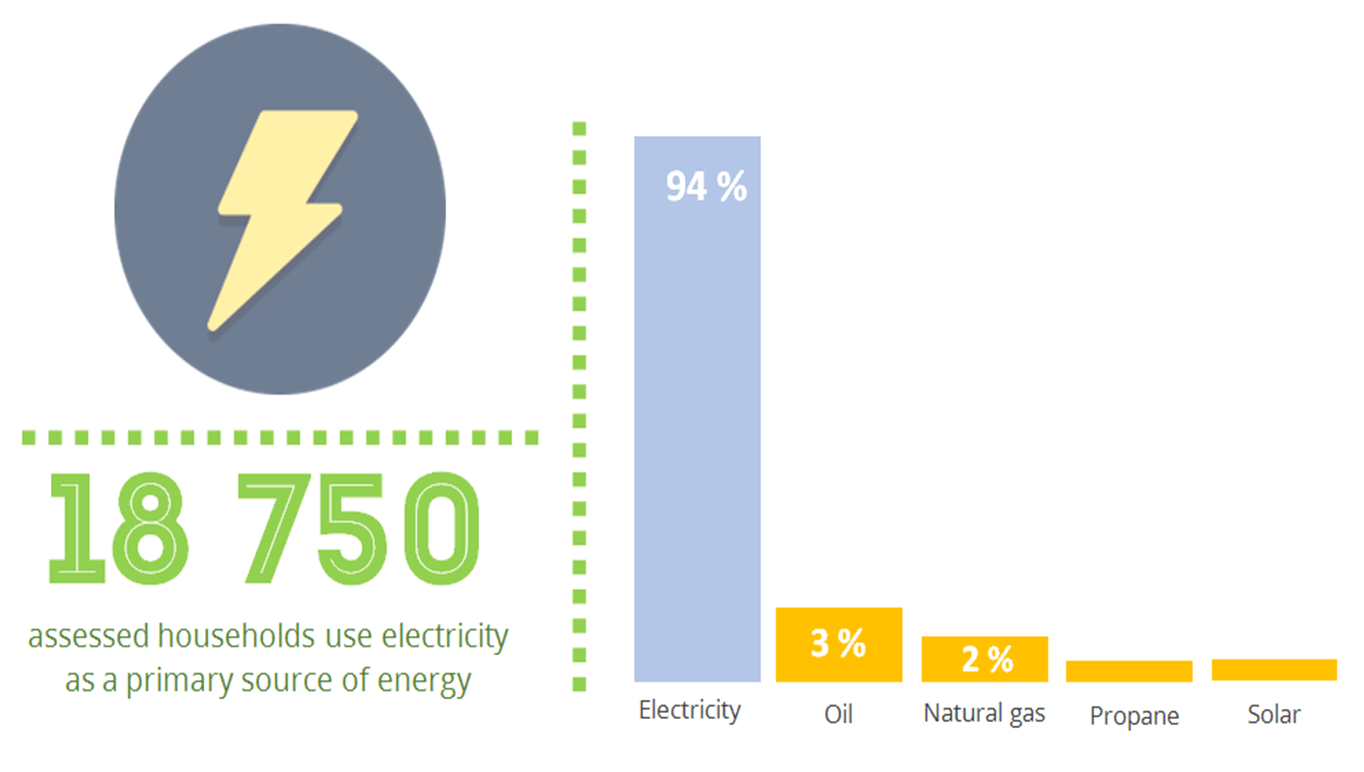
2. The most popular type of heating system without any consideration to the building’s year of construction remains the electric baseboards, which are found in no less than three out of five houses in Quebec. Furnaces rank second with a utilization rate of 35% while boilers rank third with only 3%. As for the type of energy used to run these various heating systems, no one will be surprised to learn that electricity ranks first. However, what is surprising is its popularity: 94% of Quebec homes use electricity as their primary source of energy for heating! Fuel oil comes second (3%), followed by natural gas (2%) and propane (1%).
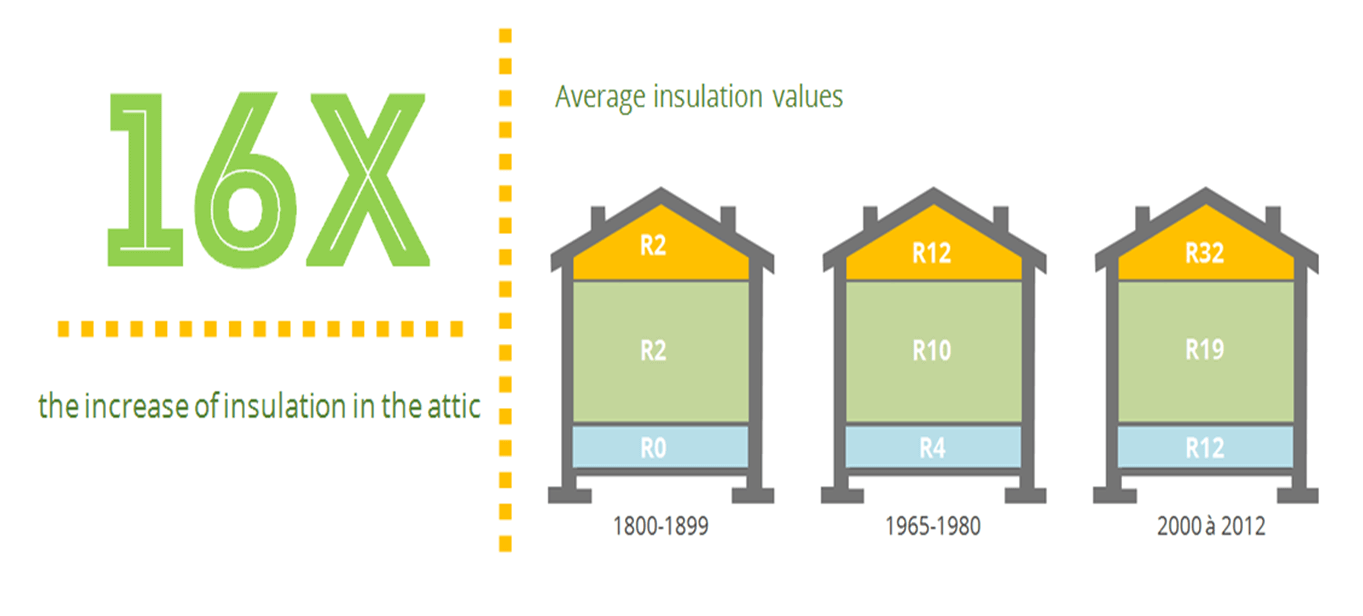
3. Construction techniques and materials have changed dramatically over the past centuries and standards have tightened to provide Quebec families with an increasingly comfortable, sustainable and efficient home. Insulating materials are no exception. The latter have an R value which increases at the same rate as their efficiency in resisting the movements of heat, hence the higher the R value of an element, the greater its insulating value. In fact, houses built in the 19th century or before did not have any insulation material added. We can therefore establish the insulating value at R5 for the exterior walls and the roof and at R0.6 for the foundation. Houses built between 1965 and 1980 benefited from an average insulation equivalent to R10 for exterior walls, R12 for the roof and R4 for the foundation. But things did not end there: for homes having been erected between 2000 and 2012 the insulating value was increased to R19 for the exterior walls, R32 for the roof and R12 for the foundation!
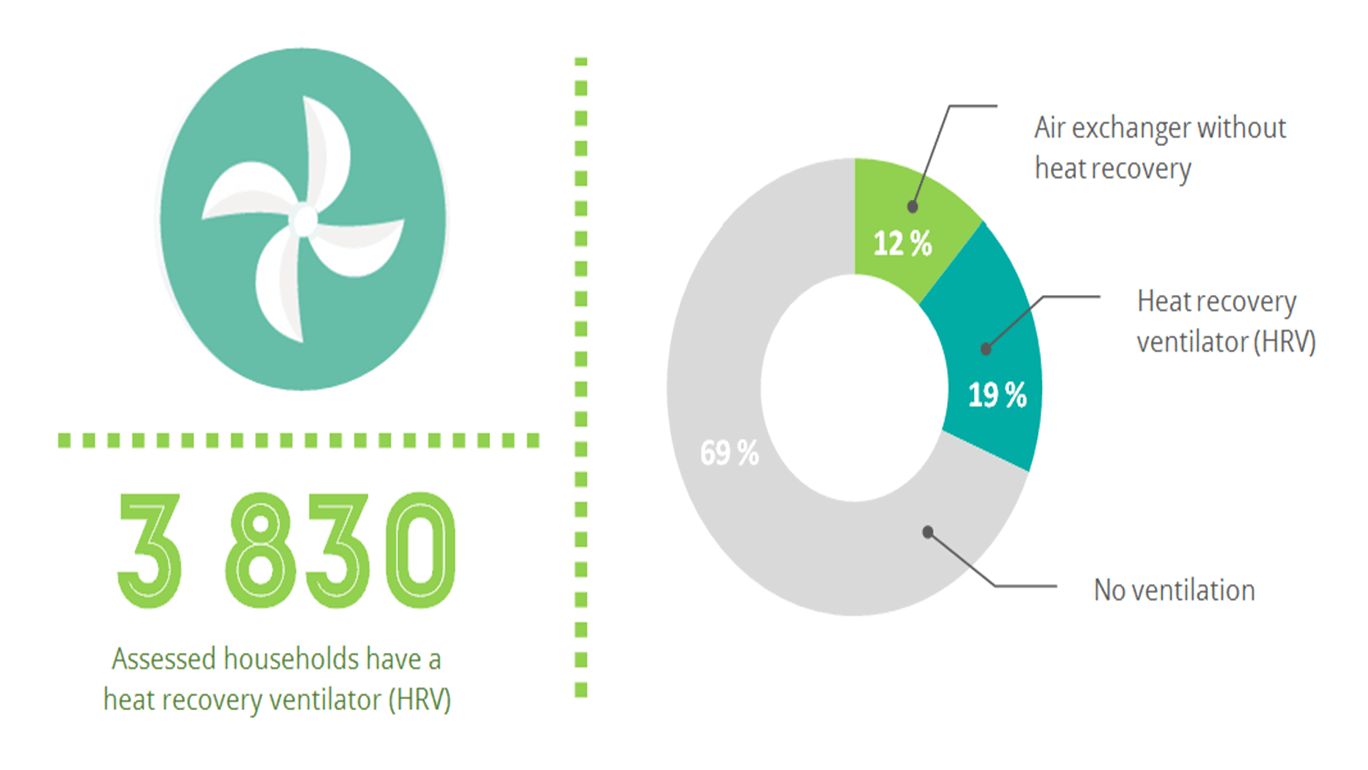
4. As mentioned in the previous point, the techniques of construction have changed considerably since the 19th century. But if the buildings are becoming more efficient year after year, they are also becoming more airtight. According to our numerous visits, two out of three houses have no mechanical ventilation other than bathroom extractors and range hoods. For the rest, 12% have an air exchanger without heat recovery and 19% have a heat recovery ventilator (HRV). And among the 3830 houses with an HRV, 1692, nearly half, were built after 2000, demonstrating the mechanical ventilation need for new airtight homes.
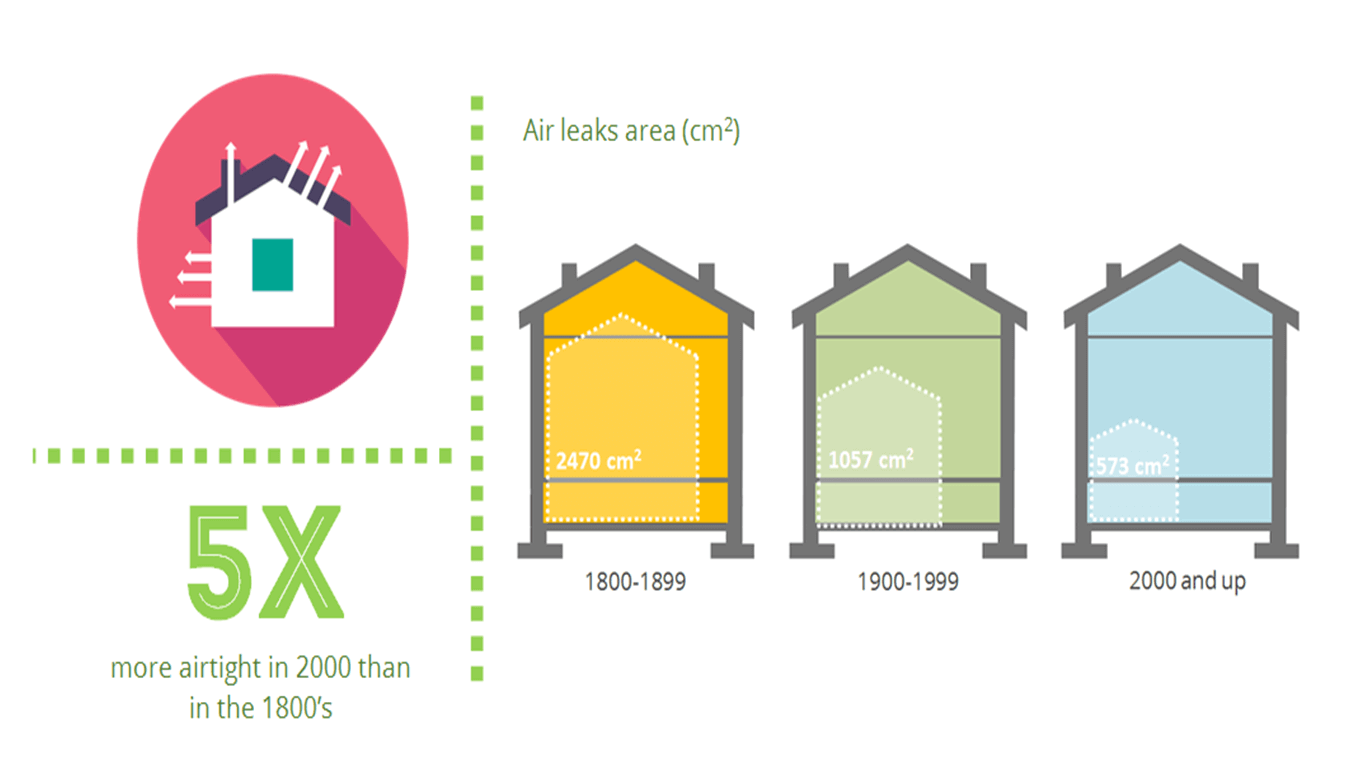
5. The infiltrometry test allows us to obtain two revealing data about buildings, including the air leakage rate (ACH) and the equivalent leakage area (ELA). The ACH represents the number of complete air changes that occur during one hour in a house with a pressure differential of 50 pascals (Pa) between the interior and the exterior of the house. The ELA represents the total air leakage area if all cracks and holes were grouped together in a single opening. For these two data, the lower the result, the tighter the building is. Consequently, the greater is the need for mechanical ventilation. Compared to homes dating from the 1800’s, homes built after 2000 have an air change rate per hour four times less and an equivalent leakage area not two or three but five times smaller!
Related Posts